While designing the last big project I worked on we chose to place some monitoring code in specific points of the application. Those metrics were meant for emitting information targeted at business users but also to technical users, this information was then split according to audience through the respective JMX agents used (was it a Tivoli ITCAM agent or a JOPR agent).
At first we were expecting only that this could provide us valuable information for live environment such as when we had anything abnormal on the legacy software we were integrating with but we ended up noticing that this could also provide us valuable informal of the operation behaviour of our software and the best part: on live environment. And in fact it turns out that this is so common that we can find others pointing into this direction as well.
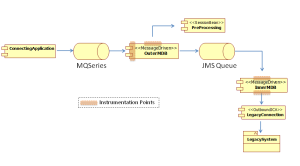
The picture below presents an overview of the application in question as well as the instrumentation points.
The instrumentation points gathered the following information:
- The instrumentation point on the left of the OuterMDB collected the sum of the messages processed in the current and last hour as well as the messages per second.
- The instrumentation point on depicted in the top of the OuterMDB collected the sum of the time spent in pre-processing as well as the number of times pre-processing was invoked.
- The instrumentation point on top of the InnerMDB collected the sum of messages processed in the current and last hour as well as the messages per second.
- And finally, the instrumentation point on the bottom of the InnerMDB collected the sum of time spent in the communication with the legacy system as well as the average of processing time per request in the current and last hour, the minimum and maximum times of processing for current and last hour and the amount of request processed as well as the timeouts.
The comparison between the number of messages processed in the InnerMDB and OuterMDB could provide us means of comparing how we should size the Thread pools for each of these components. This is such an information that would be harder to obtain by any other means. We also used those metrics for detecting misfunction on the pre-processing legacy software that was invoked by our PreProcessing component, this way we could switch off pre-processing and avoid a negative impact on overall system performance.
But this monitoring was key to the detection of a misbehavior of our JCA connector. A misimplementation of the equals/hashcode method pair for the ManagedConnection lead to a huge performance degradation after a few hours of software operation. By using our monitoring infrastructure we could isolate the problematic code area. Sure it did not point towards the equals/hashcode pair but it was clear that it was related to connection acquisition code.
Finally, the monitoring in our application provided us an effective way of monitoring the legacy application we were communicating with since it did not provide any native way of monitoring its operation. We were then able to instantly respond to outages on the legacy application through metrics collected on our software.


